Analytics Dashboard
Overview
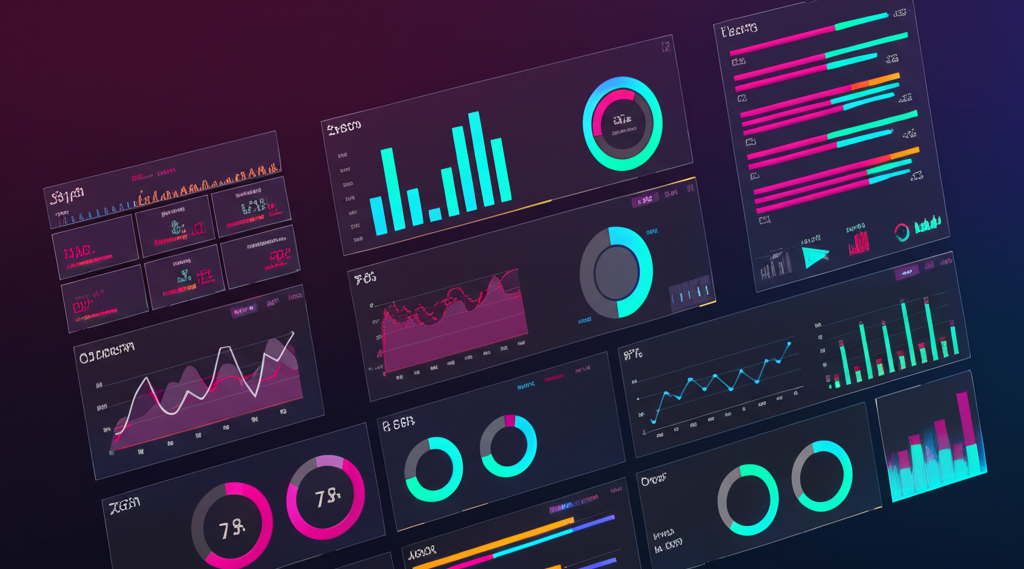
A comprehensive real-time analytics dashboard designed for business intelligence and data visualization. The platform features customizable widgets, interactive charts, automated report generation, and data export capabilities for informed decision-making.
Challenge
Processing and visualizing large datasets in real-time while maintaining responsive performance. The system needed to handle complex aggregations, support multiple data sources, and provide flexible filtering and drill-down capabilities without overwhelming the user interface.
Solution
Built a Vue.js frontend with optimized rendering for large datasets and interactive visualizations. Implemented a Laravel backend with efficient database queries and Redis caching for frequently accessed metrics. Created a modular widget system allowing users to customize their dashboard layout and data views.
Implementation
Technical Architecture
- • Vue.js 3 with Composition API for reactive data visualization
- • Laravel 10 backend with optimized Eloquent queries
- • MySQL with indexed views for fast aggregation queries
- • Redis for caching computed metrics and session data
- • Chart.js for interactive, responsive data visualizations
- • WebSocket integration for real-time metric updates
- • PDF export functionality using Laravel Snappy
Results
The dashboard successfully processes millions of data points with sub-second query times. Business teams report significantly faster insights and improved data-driven decision making.
Lessons Learned
Database optimization and strategic caching are critical for analytics applications. Implementing materialized views and Redis caching reduced query times by 85%. The modular widget architecture proved essential for user adoption—allowing users to customize their view increased engagement significantly. Real-time updates needed careful balance between freshness and performance to avoid overwhelming the system.